This article systematically explains the usage methods and practical scenarios of 8 common types of breakpoints with a defective form case, helping developers completely get rid of debugging dilemmas and significantly improve the efficiency of problem troubleshooting.
As a front-end developer, have you often faced the dilemma of abnormal application behavior without being able to locate the root cause, having to rely on repeatedly adding console.log statements for speculation? In fact, the breakpoint feature of Chrome DevTools has provided developers with the ability to “see through” the code execution process. Mastering the applicable scenarios of different types of breakpoints can transform debugging from “experience-based guessing” into a controllable and repeatable efficient process.
1. Practical Preparation: A Buggy Form Project
To demonstrate the breakpoint debugging process more intuitively, we first build a simple registration form with multiple typical defects. Later, we will use various breakpoints to locate and fix these problems one by one.
<!DOCTYPE html>
<html>
<head>
  <title>Buggy Form</title>
  <style>
    .error {color: red;}
    .success {color: green;}
  </style>
</head>
<body>
  <form id="signupForm">
    <input type="text" id="username" placeholder="Username">
    <input type="email" id="email" placeholder="Email">
    <button type="submit">Submit</button>
    <p id="message"></p>
  </form>

  <script>
    const form = document.getElementById('signupForm');
    const username = document.getElementById('username');
    const email = document.getElementById('email');
    const message = document.getElementById('message');

    function validateForm() {
      let isValid = true;
      if (username.value.length < 3) {
        message.textContent = 'Username too short';
        isValid = false;
      }
      if (!email.value.includes('@')) {
        message.textContent = 'Invalid email';
        isValid = false;
      }
      return isValid;
    }

    form.addEventListener('submit', (e) => {e.preventDefault();
      if (validateForm()) {
        message.textContent = 'Success!';
        message.className = 'success';
      } else {message.className = 'error';}
    });

    // Bug: The request is sent regardless of validation result (should only send if valid)
    fetch('https://api.example.com/submit', {
      method: 'POST',
      body: JSON.stringify({username: username.value, email: email.value})
    });
  </script>
</body>
</html>
How to Run: Save the code as an HTML file, then run it through a local server (it is recommended to use Python to start the server quickly: python3 -m http.server), and then access the corresponding address in the Chrome browser.
2. Practical Application of 8 Types of Breakpoints: Scenarios, Usage and Cases
1. Line-of-Code Breakpoint: Precisely Pause Execution
Applicable Scenarios: Used when you need to observe the variable values, scope status and control flow direction when a specific line of code is executed. It is the most basic and widely used type of breakpoint.
Setting Method:
- Open Chrome DevTools (shortcut key F12 or Ctrl+Shift+I);
- Switch to the Sources panel and find the inline script of the current HTML file in the file tree on the left;
- Click the line number next to the line of code where you want to set the breakpoint (e.g., the line of
if (username.value.length < 3)), and a blue marker indicates successful setting.
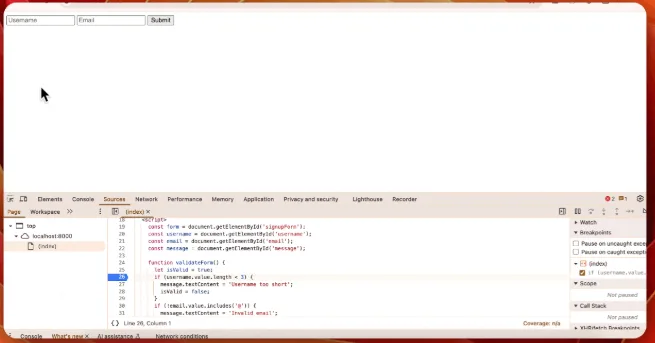
Debugging Process: After refreshing the page, enter “ab” in the username input box and submit the form. The code will pause at the line where the breakpoint is set. At this time, hover the mouse over username.value to see that the current value is “ab”; press the F10 key to execute step by step, and you can observe that isValid is set to false. At the same time, two problems can be found: the verification text will be overwritten by the subsequent email verification, and even if the verification fails, the fetch request will still be sent.
Real Business Scenario: For the “failed addition to cart” problem in the e-commerce website shopping cart, you can set a line-of-code breakpoint at the line of code corresponding to the cart addition logic to check whether the input parameters such as product ID, inventory status, and user login information are normal.
2. Conditional Breakpoint: Pause Only When Conditions Are Met
Applicable Scenarios: Used when you need to pause code execution only under specific conditions to avoid interference from irrelevant execution processes (e.g., only focusing on specific iteration values in a loop, or only targeting invalid inputs in form verification).
Setting Method: Right-click the existing line-of-code breakpoint, select “Edit breakpoint”, enter a conditional expression in the pop-up input box (e.g., username.value.length < 3), and press Enter to confirm.
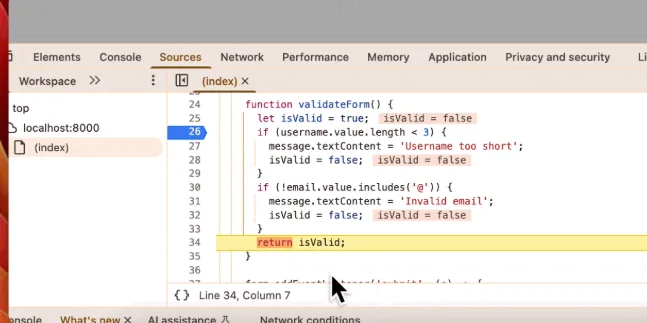
Debugging and Fixing: When “ab” is entered in the username (meeting the condition), the pause will be triggered; when “alice” is entered (not meeting the condition), the code will execute normally without pausing. When paused, it can be observed that message.textContent will be overwritten by the subsequent email verification. To solve this problem, optimize the verification logic to collect multiple messages and display them uniformly:
function validateForm() {
  let isValid = true;
  const messages = [];
  if (username.value.length < 3) {messages.push('Username too short');
    isValid = false;
  }
  if (!email.value.includes('@')) {messages.push('Invalid email');
    isValid = false;
  }
  message.textContent = messages.join(',');
  return isValid;
}
Real Business Scenario: In an instant messaging application, if some messages “disappear” after being sent, you can set a conditional breakpoint for messages missing the user ID (e.g., !message.userId) to track abnormalities in the message processing logic.
3. Logpoint: Log Only Without Pausing, Non-Intrusive Logging
Applicable Scenarios: Used when you need to observe variable changes without interrupting the code execution rhythm. It is equivalent to a “temporary console.log” and does not require modifying the code itself.
Setting Method: Right-click next to the target line of code, select “Add logpoint”, and enter a log expression in the input box (e.g., console.log('Message set to:', message.textContent)).
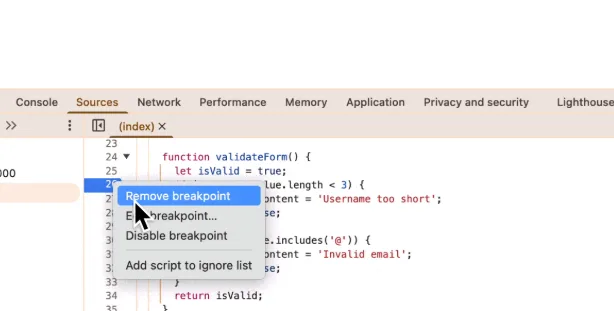
Debugging Effect: After submitting the form, the Console panel of DevTools will print the change trajectory of the message text content, which can clearly verify whether the previous problem of “text overwriting” has been solved.
Real Business Scenario: When there is an abnormality in the price calculation of e-commerce products, you can add a Logpoint at the line of the price calculation logic to output the intermediate values during the calculation process and quickly locate whether there is a problem of repeated calculation or sequence error.
4. DOM Change Breakpoint (Break on…): Track Abnormal UI Changes
Applicable Scenarios: Used when the properties, subtree or the node itself of a page element are accidentally modified, resulting in UI abnormalities. It can accurately capture the timing of the modification.
Setting Method:
- Switch to the Elements panel and select the element to be monitored (e.g.,
<p id="message">); - Right-click the element and select “Break on”, then choose the monitoring type according to your needs:
- Subtree modifications: Triggered when child nodes are added, deleted or modified;
- Attribute modifications: Triggered when element attributes (such as class, textContent) change;
- Node removal: Triggered when the element is deleted.
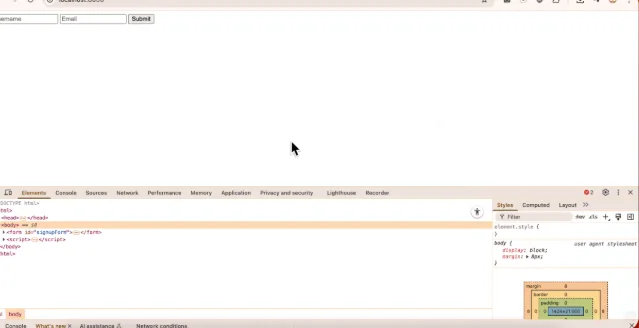
Debugging Process: Select “Attribute modifications” and submit the form. The code will pause when message.className changes. Through the call stack, you can clearly see that the modification occurs in the submit event handler. Combined with the optimized message aggregation logic, you can confirm whether the class name correctly corresponds to the verification status.
Real Business Scenario: When a data visualization chart “changes automatically” or “data disappears”, set a subtree or attribute change breakpoint for the chart container element to capture whether other scripts accidentally modify the chart DOM structure.
5. XHR/Fetch Breakpoint: Monitor Network Request Details
Applicable Scenarios: Used when you need to understand the triggering timing, request parameters, and whether repeated sending of network requests occurs. It is especially suitable for troubleshooting bugs such as “incorrect request timing” or “abnormal parameters”.
Setting Method:
- In the Sources panel, expand the “XHR/fetch Breakpoints” section;
- Click the “+” button and enter the keyword contained in the request URL to be monitored (e.g.,
api.example.com); - Refresh the page, and when a request matching the URL is initiated, the code will automatically pause.
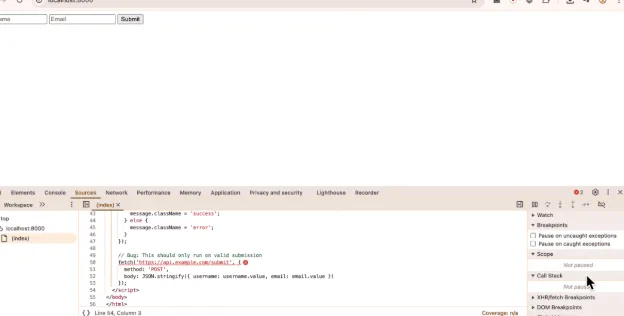
Debugging and Fixing: Through the breakpoint, it can be found that the fetch request is triggered outside the form verification logic, resulting in the request being sent regardless of whether the verification passes or not. Move the fetch request to the branch where “verification passes” to complete the fix:
form.addEventListener('submit', (e) => {e.preventDefault();
  if (validateForm()) {
    message.textContent = 'Success!';
    message.className = 'success';
    // Fixed: Only send the request if verification passes
    fetch('https://api.example.com/submit', {
      method: 'POST',
      body: JSON.stringify({username: username.value, email: email.value})
    });
  } else {message.className = 'error';}
});
Real Business Scenario: For the problem of “displaying old data” in a weather application, you can set an XHR breakpoint for the weather API URL to check whether the request is initiated too early when the page is loaded or whether the parameter carries incorrect geographical location information.
6. Event Listener Breakpoint: Track Event Trigger Process
Applicable Scenarios: Used when you need to confirm whether events such as button clicks and form submissions are triggered correctly or intercepted by other scripts.
Setting Method: In the Sources panel, expand the “Event Listener Breakpoints” section, and check the corresponding option according to the event type (e.g., the form submission event is under the “Control” category as “submit”).
Debugging Process: Check “submit” and click the form submission button. The code will pause at the callback function of the submit event. Through step-by-step execution, you can confirm whether the event is triggered normally and whether each variable value meets the expectations.
Real Business Scenario: When the “jump” key in a game application has a response delay, you can set a listener breakpoint for the “keydown” or “click” event to check whether other event listeners take too long to execute, causing the main thread to be blocked.
7. Exception Breakpoint (Pause on Exceptions): Capture Silent Failures
Applicable Scenarios: Used when the application has “unexplained crashes” or “silent failures” (no error prompts but abnormal functions). It can pause the code directly at the exception throwing point.
Setting Method: At the top of the Sources panel, check “Pause on uncaught exceptions” (only capture exceptions not caught by catch); if you need to capture all exceptions (including those caught by catch), you can also check “Pause on caught exceptions” at the same time.
Notes: Some exceptions thrown internally by the browser (such as net::ERR_NAME_NOT_RESOLVED for fetch requests) will not be captured by this option. Such network errors need to be troubleshooted in combination with the Network panel.
Real Business Scenario: When there is no response after clicking “Confirm Payment” in the payment process, enabling the exception breakpoint can locate whether an unhandled exception (such as incorrect data format) is thrown when reading the payment order data.
8. Function Breakpoint (debug(fn)): Monitor Function Calling Timing
Applicable Scenarios: Used when you need to monitor the calling frequency, calling timing or incoming parameters of a function. It is especially suitable for troubleshooting the problem of “unexpected function calls”.
Setting Method: Enter debug(function name) (e.g., debug(validateForm)) in the Console panel of DevTools and press Enter.
Debugging Process: After setting, every time the validateForm function is called, the code will automatically pause at the first line of the function, and you can observe the parameters and context environment during the call.
Real Business Scenario: When the search box “refreshes automatically” without entering content, you can set a debug breakpoint for the search function to check whether it is incorrectly triggered in irrelevant events such as page scrolling and window resizing.
3. Upgrading Debugging Thinking: From “Guessing” to “Controlling”
Most developers only use the Console panel of DevTools to print logs in the early stage, regarding it as an “enhanced console”. However, when you are proficient in the above various types of breakpoints, the debugging experience will achieve a qualitative leap:
- Accuracy: There is no need to rely on a large number of logs to narrow down the problem scope; you can directly pause at key nodes to observe the real-time status;
- Efficiency: Features such as conditional breakpoints and Logpoints can reduce invalid pauses and focus debugging on problem scenarios;
- Depth: Through the call stack and scope viewing, you can quickly locate the root cause of the problem, rather than just staying on the surface phenomenon.
When encountering application abnormalities in the future, it is recommended to first select a suitable breakpoint according to the problem type: use DOM change breakpoints for UI abnormalities, XHR breakpoints for network problems, and line-of-code breakpoints or conditional breakpoints for logical errors. Developing the habit of “selecting breakpoints according to scenarios” can make debugging work fast, accurate and stable, and effectively locate various defects.
